User Manual
Try our online system to get an initial experience of the user interface.
Trail list and Data list
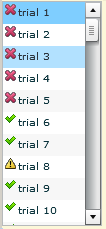
Trial list contains all the trials in the experiment.
You can select a trial by mouse click or up/down key. You
can also mark a trial as valid or
![]() (invalid) by pressing the delete key, or
by selecting the menu item Edit->Mark Trial.
(invalid) by pressing the delete key, or
by selecting the menu item Edit->Mark Trial.
Icons before each trial represent drift correct result before
current trial.
![]() :
means drift is less than 0.5 degree to the drift correction
position.
:
means drift is less than 0.5 degree to the drift correction
position.
![]() :
means drift is greater than 0.5 degree to the
drift correction position.
:
means drift is greater than 0.5 degree to the
drift correction position.
![]() :
means no drift correction information before current trial.
:
means no drift correction information before current trial.
Drift information will also be displayed in saccade viewer as a
green circle with a green line, indicating the drift correction
position and shift.
Trial list and Data list
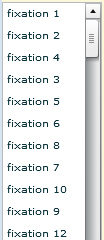
Data list contains event information of a trial. The contents will change when you are selecting between different views. As shown in the figure above, labels with even numbers indicate left eye events and with odd numbers, right eye events. All the events are displayed in temporal order. When the user selects an item in the data list, related events will be highlighted in the current view. You can select multiple events in editing mode.
Fixation View
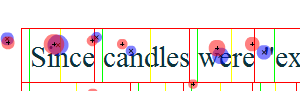
Fixation View is a viewer that displays the
fixation events. It will also display the text background based
on information from text.html. As shown in the figure below,
red rectangles represent word boundaries including space and punctuation,
green rectangles represent word boundaries excluding spaces and
punctuation, and the yellow line indicates the centre of the word. Users can
hide/show these boundaries by selecting sub-items under the Menu View.
Fixation View has different behaviours in editing mode compared to viewing
mode. In viewing mode, users can play the fixations in temproal order
by rotating the mouse wheel. Red dots in the view represent right
eye fixation events, while blue indicates left eye events. The size of
dots indicate either fixation duration or mean pupil size, or a fixed
value. Users can change the meaning by a right mouse click and select the corresponding
item in the context menu. If you see a black dot under a fixation,
this means that a blink event occurred prior to that fixation. The
size of the black dot represents blink duration. Users can active/deactivate
blink dots by pressing the
![]() button.
Users can select a dot by a mouse click and this will highlight the
selected dots and dim the rest. Users can also double click the fixation
view to zoom in. If the view is already zoomed, a double click will
return the view to normal.
button.
Users can select a dot by a mouse click and this will highlight the
selected dots and dim the rest. Users can also double click the fixation
view to zoom in. If the view is already zoomed, a double click will
return the view to normal.
Users can press the
![]() button in the top right corner to activate edit mode. In edit
mode, you will see an extra data grid view on the bottom.
Now, users can select multiple dots by dragging a rectangle or multi-selecting
them in the data list. All selected events will be displayed
on the data grid view. The data grid view allows users to sort and
modify the data manually. To move the selected fixation dots up
and down users can always use the mouse wheel directly. If users want
to move them left and right, they can hold the Ctrl key while
rotating the mouse wheel. To confirm the modification, users should double
click the view and this will submit all the modification and then
dim all the selected dots. To cancel the modification,
just select another trial in the trial list and this will
quit edit mode and move the view to the new trial. Remember,
modifications will affect all the calculations and take effect immediately,
but they do not change the original data unless the user saves the modification
by selecting the menu item File->Save.
button in the top right corner to activate edit mode. In edit
mode, you will see an extra data grid view on the bottom.
Now, users can select multiple dots by dragging a rectangle or multi-selecting
them in the data list. All selected events will be displayed
on the data grid view. The data grid view allows users to sort and
modify the data manually. To move the selected fixation dots up
and down users can always use the mouse wheel directly. If users want
to move them left and right, they can hold the Ctrl key while
rotating the mouse wheel. To confirm the modification, users should double
click the view and this will submit all the modification and then
dim all the selected dots. To cancel the modification,
just select another trial in the trial list and this will
quit edit mode and move the view to the new trial. Remember,
modifications will affect all the calculations and take effect immediately,
but they do not change the original data unless the user saves the modification
by selecting the menu item File->Save.
Saccade View
Saccade view is used to display saccade events. Similar to fixation view, red indicates a right eye event and blue a left eye event. Users can also play the saccade event in temporal order by rotating the mouse wheel.

Playback View
Playback view is designed to playback saccade and fixation events. Users can control the playback speed by rotating the mouse wheel. When the mouse is moved outside the view, the playback will stop immediately until the mouse moves inside view again.
Raw Curve/Raw Pupil Size View
Users can activate these two views by pressing the
![]() button in the top right corner. However, this requires that you have
already extracted the raw data files and saved them into the xxx.raw
folder. To extract raw data, users have to set <rawout> option
true in the config.xml. Raw Curve displays the raw eye movement data
curve and Raw Pupil Size View displays a line chart of pupil size
change based on the raw data. Similar to previous views,
red means a right eye event, blue a left eye event.
button in the top right corner. However, this requires that you have
already extracted the raw data files and saved them into the xxx.raw
folder. To extract raw data, users have to set <rawout> option
true in the config.xml. Raw Curve displays the raw eye movement data
curve and Raw Pupil Size View displays a line chart of pupil size
change based on the raw data. Similar to previous views,
red means a right eye event, blue a left eye event.
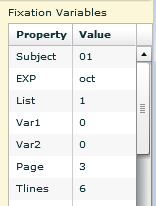
Fixation Variables List
Fixation Variable List contains all the exported variables, which are defined in the export.xml file. The calculation of these variables is dynamic.
Toolbar Buttons
![]() /
/![]() Right/Left Eye buttons: the eye button is used to hide/show right/left
eye related events in different views. They also affect the data
export. For example, if the right eye in the fixation view is hidden,
the export data file will exclude all the right eye events.
Right/Left Eye buttons: the eye button is used to hide/show right/left
eye related events in different views. They also affect the data
export. For example, if the right eye in the fixation view is hidden,
the export data file will exclude all the right eye events.
![]() Reload button: by pressing this button, Eye map will reload the
text.html, export.xml, trial.csv and word.csv. If these file
are changed before the reload, all related displays will be updated
immediately after reload.
Reload button: by pressing this button, Eye map will reload the
text.html, export.xml, trial.csv and word.csv. If these file
are changed before the reload, all related displays will be updated
immediately after reload.
![]() Zoom in button: this is actually a zoom in replay button. It will
replay latest zoom in operation. If the fixation view is already
zoomed in, the fixation view is returned to normal.
Zoom in button: this is actually a zoom in replay button. It will
replay latest zoom in operation. If the fixation view is already
zoomed in, the fixation view is returned to normal.
![]() Blink button: As mentioned in the Fixation View, the blink button can show/hide
blink events that occurred before a fixation.
Blink button: As mentioned in the Fixation View, the blink button can show/hide
blink events that occurred before a fixation.